
Nếu như bạn còn đang lăn tăn không biết cách mô tả một biểu đồ trong IELTS Writing sao cho đúng thì bài viết ngày hôm nay của WISE ENGLISH sẽ giúp các bạn giải đáp những thắc mắc về cách viết phần BODY – Graphs with a trend (Biểu đồ biến thiên theo thời gian/biểu đồ xu hướng) của cuốn sách IELTS Writing task 1.
I. Biểu đồ biến thiên theo thời gian là gì?
Graphs with a trend hay còn gọi là dynamic chart là những biểu đồ thể hiện sự thay đổi của dữ liệu theo thời gian (năm, thập kỉ,…).
Tips viết bài cần lưu ý:
- Tập trung vào sự thay đổi trong khoảng thời gian đề bài cho
- Sử dụng trạng từ và tính từ đi kèm với động từ và danh từ để mô tả biểu đô
- Sử dụng từ vựng phù hợp với mô tả biểu đồ
- Đừng quên so sánh những đặc điểm khác nhau trong biểu đồ
Xem thêm: IELTS Writing Task 1 – Dạng bài Proccess
II. Một số từ vựng hữu ích trong IELTS Writing task 1
Những từ vựng/ cụm từ trong các bảng dưới đây được sử dụng để mô tả những thay đổi trong 1 biểu đồ
1. Từ vựng mô tả các xu hướng lên hoặc xuống

E.g.1: The expenditure on food and clothes rose by $1000.
(Sự chi tiêu cho thức ăn và quần áo tăng đến $1000.)
E.g.2: There was a drop in the number of people who cycled in 2011.
(Sự chi tiêu cho thức ăn và quần áo tăng đến $1000.)
2. Từ vựng mô tả sự không thay đổi hoặc sự thay đổi bất thường
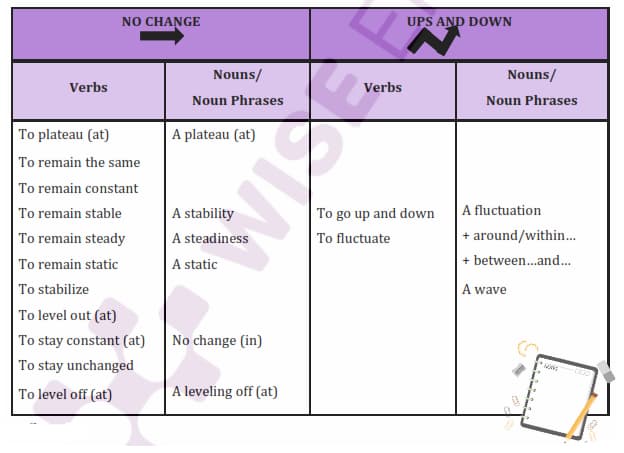
E.g:There was a fluctuation in the number of people owning cars in Europe between 2000 and 2005.
(Có một sự thay đổi bất thường về số người sở hữu xê ô tô ở Châu Âu giữa năm 2000 và 2005.)
3. Từ vựng mô tả điểm cao nhất và thấp nhất trong biểu đồ
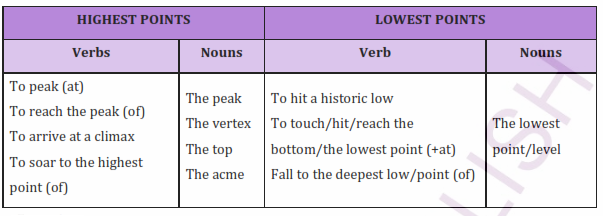
E.g: The number of viewers reached the peak of/ peaked at 3.8 million in May.
(Số lượng người xem đạt đỉnh điểm 3.8 triệu vào tháng 5.)
Tìm hiểu thêm: 05 cấu trúc mô tả MAP trong IELTS Writing Task 1
III. Một số cấu trúc thông dụng
1. Mô tả xu hướng tăng hoặc giảm
Cấu trúc 1:
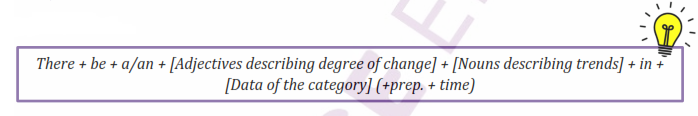
E.g: There was a significant growth in the number of visitors in Vietnam in 2005.
(Có một sự tăng trưởng đáng kể về số lượng khách du lịch tại Việt Nam vào năm 2005.)
Cấu trúc 2:
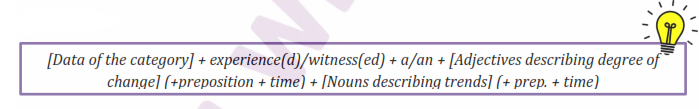
E.g: The number of visitors in Vietnam experienced a significant increase in 2005.
(Số lượng khách du lịch tại Việt Nam có một sự tăng trưởng đáng kể vào năm 2005.)
Cấu trúc 3:
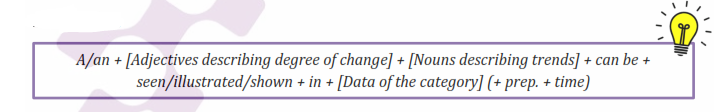
E.g: A significant growth can be seen in the number of visitors in Vietnam in 2005.
(Một sự tăng trưởng đáng kể có thể được thấy rõ ở số lượng khách du lịch tại Việt Nam vào năm 2005.)
2. Mô tả sự tăng lên sau đó giảm xuống
Cấu trúc 1:
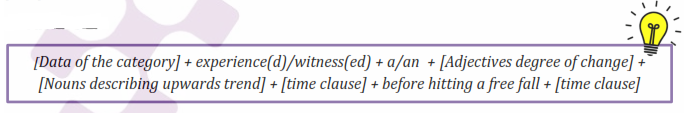
E.g: The number of visitors in Vietnam witnessed a dramatic increase in 2005 before hitting a
free fall in 2010.
(Số lượng khách du lịch tại Việt Nam trải qua một sự tăng trưởng mạnh mẽ vào năm 2005 trước khi giảm nhanh chóng vào năm 2010.)
Cấu trúc 2:
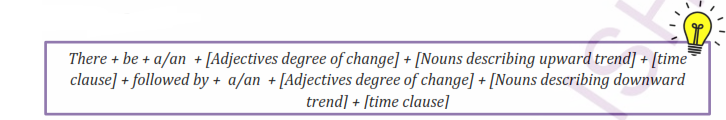
E.g: There was a dramatic growth in the number of visitors in Vietnam in 2005, followed by a significant decline in 2010.
(Đã có một sự tăng trưởng mạnh mẽ về số lượng khách du lịch ở Việt Nam vào năm 2005, theo sau đó là một sự sụt giảm đáng kể vào năm 2010.)
3. Mô tả sự đảo chiều trong cùng một giai đoạn
Cấu trúc 1:

E.g: As/while the number of visitors in Vietnam experienced a dramatic increase, the figure for
Thailand’s tourists plummeted significantly at the same time.
(Trong khi số lượng khách du lịch ở Việt Nam đã có một sự tăng trưởng mạnh mẽ, con số này tại Thái Lan lại giảm xuống đáng kể trong cùng một giai đoạn.)
Tham khảo thêm: Dạng bài Line Graph trong IELTS Writing Task 1
IV. Bài viết với từng loại biểu đồ
1. Biểu đồ đường (Line graph)
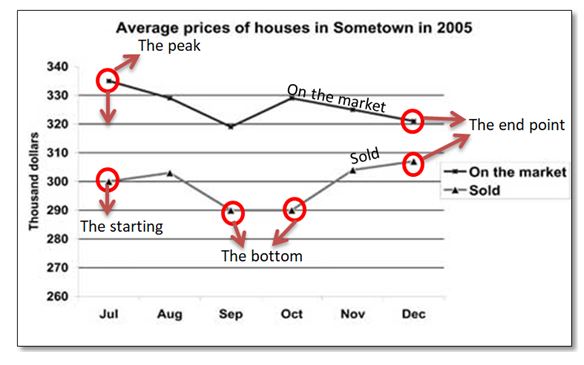
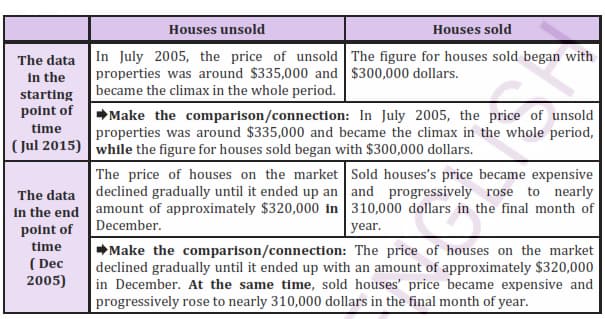
The graph describes average house prices in Sometown in 2005.
- Lựa chọn thông tin
- Điểm bắt đầu và kết thúc (So sánh)
- Những đặc điểm nổi bật nhất:
- BODY PARAGRAPH
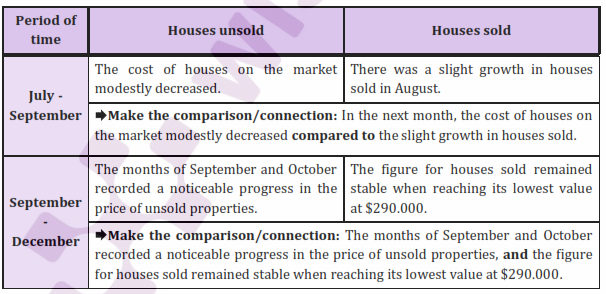
In July 2005, the price of unsold properties was around $335,000 and became the climax in the whole period, while the figure for houses sold began with $300,000 dollars. In the next month, the cost of houses on the market modestly decreased compared to the slight growth in houses sold. The months of September and October recorded a noticeable progress in the price of unsold properties, and the figure for houses sold remained stable when reaching its lowest value at $290,000. During the remainder of the year, the price of houses on the market declined gradually until it ended up with an amount of approximately $320,000 in December. At the same time, sold houses’s price became expensive and progressively rose to nearly $310,000 dollars in the final month of year.
Exercises:
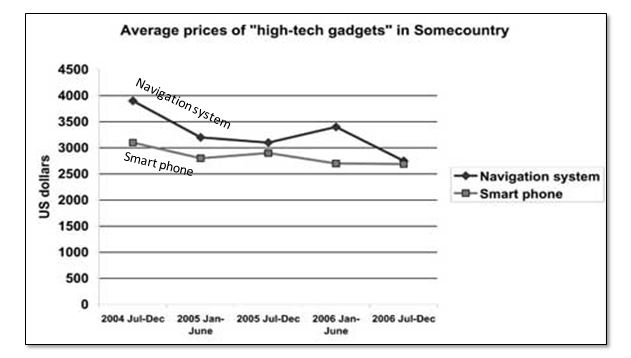
Select the information and write the body paragraphs for this graph: The graph below shows how prices of “high-tech gadgets” changed over time in some countries.
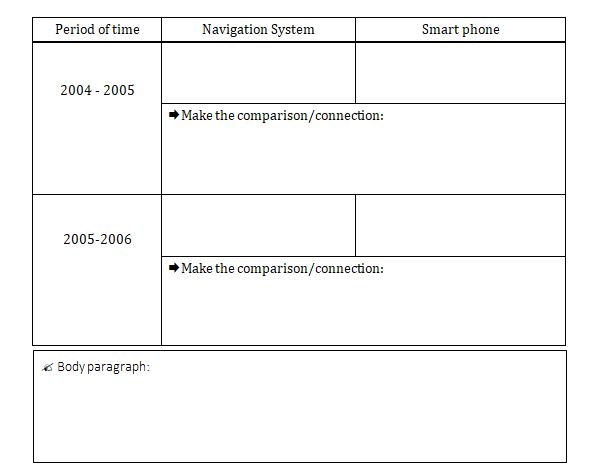
- Select the information:
- Điểm bắt đầu và kết thúc (So sánh)
| Navigation System | Smartphone | |
| The data in the starting point of time | ||
| Make the comparison/connection: | ||
| The data in the endpoint of time | ||
| Make the comparison/connection: | ||
- Những đặc điểm nổi bật nhất:

2. Bar chart in IELTS Writing task 1
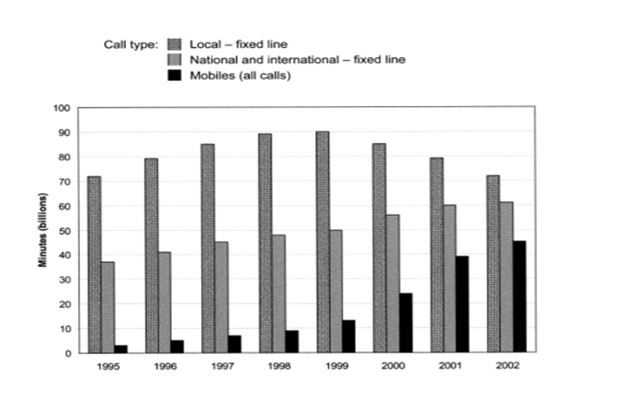
The chart below shows the total number of minutes (in billions) of telephone calls in the UK, divided into three categories, from 1995-2002.
CÁCH VIẾT 1:
BODY 1: Mô tả dữ liệu từ năm 1995 đến 1998
BODY 2: Mô tả dữ liệu từ năm 1999 đến 2002
– In 1999, the data of local-fixed lines reached its peak.
– In 2000, the amount of time spent on local calls decreased while data of two remaining categories went up.
– In 2002, the figure for International & National-fixed line and Mobiles arrive at their climax
over the whole period of time.
- BODY PARAGRAPH:
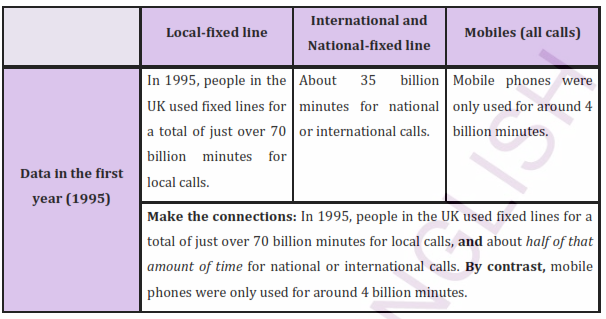
In 1995, people in the UK used fixed lines for a total of just over 70 billion minutes for local calls, and about half of that amount of time for national or international calls. By contrast, mobile phones were only used for around 4 billion minutes. Over the following four years, the figures for all three types of phone call increased steadily.
By 1999, the amount of time spent on local calls using landlines had reached a peak of 90 billion minutes. Subsequently, the figure for this category fell, but the rise in the other two types of phone calls continued. In 2002, the number of minutes of national/ international landline calls passed 60 billion, while the figure for mobiles rose to around 45 billion minutes.
CÁCH VIẾT 2:
BODY 1: Mô tả dữ liệu có cùng xu hướng
National/International landline calls và Mobiles có cùng xu hướng
- National and international calls increased steadily year on year, from just under 40 billion minutes in 1995 to a peak of just over 60 billion in 2002. Mobile minutes increased at a very rapid pace from approximately 3 billion in 1995 to around 45 billion in 2002. Mobile phone usage nearly doubled from approximately 22 billion minutes in 2000 to 40 billion in 2001.
BODY 2: Mô tả dữ liệu có xu hướng khác
- Minutes spent on local calls fluctuated over the time period, with just over 70 billion minutes in 1995, peaking at approximately 90 billion in 1999 and then steadily decreasing to just over 70 billion minutes in 2002.
Exercises: Viết đoạn thân bài cho đề bài sau theo 2 cách hướng dẫn phía trên.
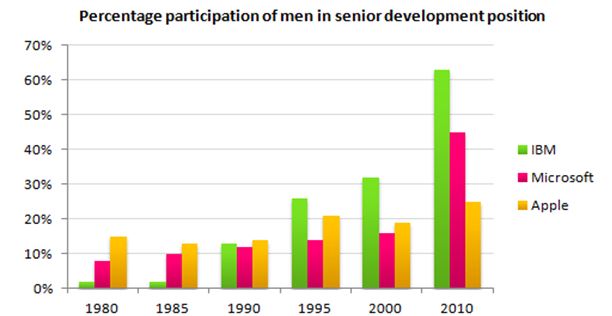
The bar chart below shows the percentage participation of men in senior development in three companies between 1980 and the year 2010.
3. Table + Pie chart in IELTS Writing task 1
Đối với Table và Pie chart, phần thân bài nên chia thành hai đoạn mô tả hai xu hướng khác nhau (tăng và giảm).
Table
Để xác định xu hướng trong Table, cách đơn giản nhất đó là vẽ đường xu hướng theo dữ liệu từng năm như sau:
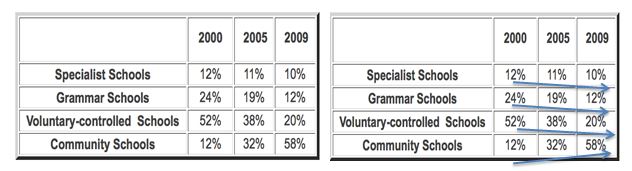
Eg. The table shows the Proportion of Pupils Attending Four Secondary School Types between 2000 and 2009.
Sau khi vẽ xong chúng ta có thể xác định được xu hướng của các dữ liệu như sau:
- Xu hướng tăng: Specialist Schools, Grammar Schools and Voluntary-controlled Schools
- Xu hướng giảm: Community Schools
- Body Paragraph 1: In 2000, the proportion of attendance at specialist schools was 20%, but it gradually decreased in 2009 by 2%. Even in grammar schools, the percentage of participation dropped at 12% in 2009 which was 24% in 2000. Overall, a bit more than half of the percentage of school children went to schools that were voluntary-controlled in 2000. The percentage sharply declined up to 20% in 2009.
- Body Paragraph 2: Community schools, by contrast, were not so popular in 2000, only 12% of the students attended. But rising at 32% in 2005, the schools became the highest in student participation in 2009, with 58%.
Pie charts
Xác định xu hướng trong Pie chart cần dựa vào kích thước của các phần trong biểu đồ tròn.
Eg:
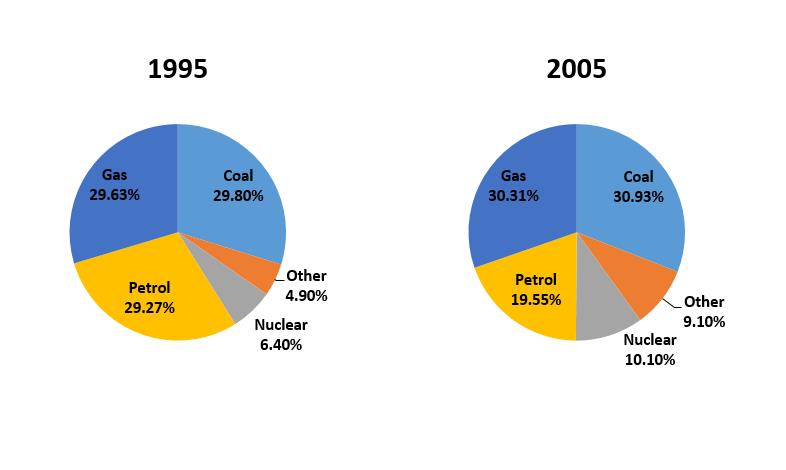
Đối với bài này, chúng ta có thể phân chia thân bài thành hai đoạn, mỗi đoạn mô tả thông tin của mỗi năm (1995 và 2005).
- Body Paragraph 1: In 1995, the energy produced by coal accounted for the highest proportion, at 29.80% of the total energy production in France. The figures for Gas and Petro were slightly lower, at 29.63% and 29.27% respectively. Meanwhile, only 6.40% of the total energy was generated by Nuclear and the lowest figure can be seen in the percentage of energy produced by other sources, at nearly 5%.
- Body Paragraph 2: In 2005, the percentage of energy from Coal went up insignificantly but remained the highest figure in the chart, at 30.93%. The figure for Gas rose slowly to 30.31%, while that for Petrol experienced a dramatic fall of nearly 10%. There were sharp increases to 10.10% and 9.10% in the figures for Nuclear and Other sources respectively.
Dành riêng cho bạn: Tổng hợp các bài mẫu IELTS Writing Task 1
V. Bài tập trong IELTS Writing task 1
1. Bài tập 1
2. Bài tập 2
Hy vọng bài viết đã giúp các bạn giải đáp được những thắc mắc liên quan đến cách viết một BODY trong bài thi IELTS Writing Task 1.
Đừng quên follow fanpage WISE ENGLISH và Group cộng đồng nâng band WISE ENGLISH để học thêm nhiều bí kíp giúp bạn NÂNG BAND THẦN TỐC và chinh phục các nấc thang của IELTS bằng Phương Pháp Học Vượt Trội và Lộ Trình Cá Nhân Hóa nhé.
Tìm hiểu thêm:
Khóa học IELTS cho người mới bắt đầu từ 0 – 7.0+ trong vòng 150 buổi
Trung Tâm Luyện Thi Ielts Đà Nẵng Tốt Nhất Không Thể Bỏ Qua