
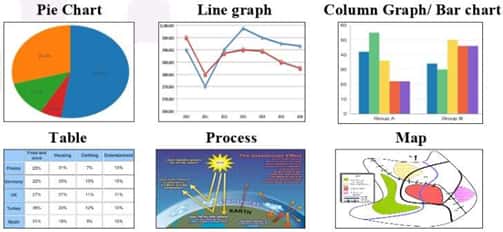
IELTS Writing Task 1 yêu cầu bạn viết một báo cáo từ các thông tin được mô tả trên biểu đồ, sơ đồ, bản đồ. Có các dạng biểu đồ sau: Line graph (biểu đồ đường), Bar chart (biểu đồ cột), Pie chart (biểu đồ tròn), Table (bảng), Process diagram (sơ đồ minh họa một quy trình). Bạn cần phải viết tối thiểu 150 từ trong vòng 20 phút.

Ở bài học này, WISE ENGLISH sẽ định nghĩa những kiến thức tổng quát và nền tảng quan trọng để bạn có thể hoàn thành phần introduction của bài thi IELTS WRITING TASK 1 một cách tốt nhất.
I. Tiêu chí chấm điểm
- Task Achievement: Bạn có trả lời đúng trọng tâm câu hỏi không?
- Coherence and Cohesion: Bài viết của bạn có mạch lạc và logic không?
- Lexical Resource: Bạn có sử dụng từ vựng một cách chính xác và thích hợp không? Bạn viết đúng chính tả không?
- Grammatical Range and Accuracy: Bạn có sử dụng nhiều cấu trúc câu khác nhau hay bạn luôn sử dụng những cấu trúc câu giống nhau? Phần thi của bạn mắc những lỗi ngữ pháp như thế nào?
Các dạng biểu đồ:
Outline
|
Xem thêm: IELTS WRITING – Cách viết Overview
II. Chi tiết cách viết phần mở bài
Đề bài sẽ chỉ ra một vài thông tin cụ thể về biểu đồ: đối tượng mô tả, thành phần, đơn vị của biểu đồ, thời gian, địa điểm. Bạn sẽ viết phần mở bài bằng cách thay thế những từ đã được sử dụng ở câu hỏi bằng các từ đồng nghĩa của chúng hoặc thay đổi cấu trúc câu nhưng không làm thay đổi nghĩa. bạn chỉ cần viết 1-2 câu cho phần mở bài.
1. Ví dụ
Question: The bar chart illustrates the amount of leisure time enjoyed by males and females of five categories of employment status in 1998-1999.
2. Cấu trúc
| Type of charts (subject) | Main verb | Object noun clause | |
| The | Chart Graph Table Diagram Map | Shows Indicates Illustrates Gives Represents Describes Reveals Compares Demonstrates | The amount of … The number of … The proportion of … Information about/ on … Data on/ about … That … |
| Figures Statistics Charts Graphs Graph and table | Show Indicate Illustrate Give Represent Describe Reveal Compare Demonstrate | ||
Examples:
- Question: The graphs below give information about computer ownership as a percentage of the population between 2002 and 2010, and by the level of education for the years 2002 and 2010.
- Introduction: The bar charts show data about computer ownership as a percentage of the population between 2002 and 2010, and by the level of education for the years 2002 and 2010.
3. Chú ý các lỗi thường gặp:
→ Number
- Sau number là danh từ đếm được số nhiều (VD: the number of visitors.)
- Không sử dụng với tỷ lệ phần trăm hoặc danh từ không đếm được. (VD: money).
→ Amount
- Sau amount là danh từ không đếm được (VD: the amount of money).
- Đây là một lỗi thường gặp trong các bài thi viết, vậy nên chúng ta lưu ý không sử dụng Amount với danh từ đếm được (VD: the amount of person/people).
→ Proportion
- Chỉ sử dụng với tỷ lệ phần trăm, không sử dụng với số
- Sau proportion có thể là danh từ đếm được hoặc danh từ không đếm được. (VD: the proportion of people/ the proportion of domestic water).
- Proportion = Fraction = Percentage = A/B
→ Figure
- the figure for + plural noun (VD: the figure for visitors to the UK).
- the figure for + uncountable nouns (VD: the figure for unemployment).
- the figure for + countries (VD: the figure for Canada).
- Có thể sử dụng với tỷ lệ phần trăm (the figure for … rose to 10%).
→ Compare
- compares something in terms of something
E.g: The charts compare two cities in terms of the number of employed people.
- compares something in year1 and year2
E.g: The graph compares the population in 2000 and 2013.
→ Information/data on/about + phrase/ Noun phrase
E.g: The Graph provides information about the changing trend of the use of modern technology in homes in the UK.
→ How
- Sau how sẽ là một mệnh đề (E.g: the graph gives information about how many people were employed in India).
- How much + uncountable noun (E.g: The graph shows information about how much money was earned by three bakeries in London, over a decade between 2000 and 2010).
- How many + plural noun (E.g: The graph highlights data about how many people visited three different cities between 2000 and 2010).
→ Synonyms:
- number of = quantity of
- spending = expenditure
- rate = percentage
- ratio = proportion
- information = data
- change = variation
- share = portion
- place = site
→ Time periods
- from 1985 to 1995 = between 1985 and 1995
- in 1985 = in the year 1985
- in 1985 and 1995 = in 1985 and 1995 respectively = in the years 1985 and 1995
Có thể bạn quan tâm: IELTS WRITING TASK 2 – Cách lập dàn ý (Planning)
III. Bài tập tự luyện cho phần introduction:
1. Bài tập 1
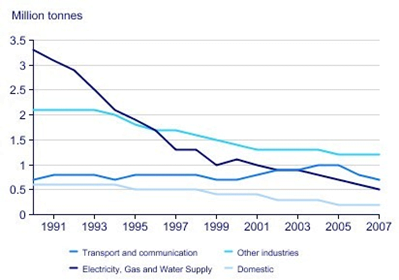
The graph below shows UK acid rain emissions, measured in millions of tonnes, from four different sectors between 1990 and 2007.
→ Introduction:
2. Bài tập 2
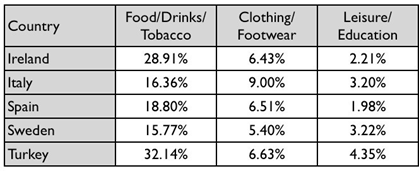
The table below gives information on consumer spending on different items in five different countries in 2002.
→ Introduction:
3. Bài tập 3
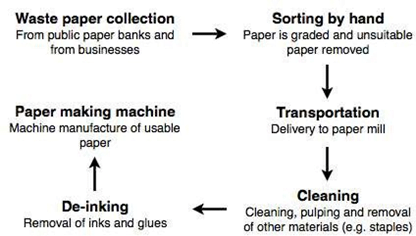
The chart below shows the process of waste paper recycling.
→ Introduction:
4. Bài tập 4
Chorleywood is a village near London whose population has increased steadily since the middle of the 19th century. The map below shows the development of the village.
→ Introduction:

5. Bài tập 5
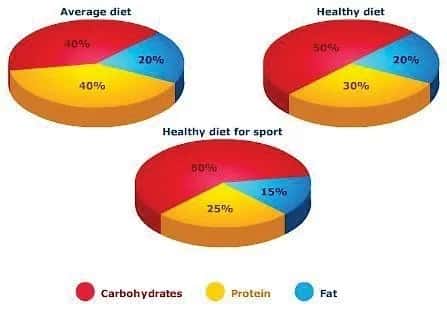
The table below gives information on the proportion of carbohydrates, protein and fat in three different diets. Write a report for a university lecturer describing the information shown below. Make comparisons where relevant.
→ Introduction:
Dành riêng cho bạn: IELTS WRITING TASK 2 – Cách viết Introduction

IV. Đáp án
Bài tập 1:
The line graph compares four sectors in terms of the amount of acid rain emissions that they produced over a period of 17 years in the UK.
Bài tập 2:
The table shows percentages of consumer expenditure for three categories of products and services in five countries in 2002.
Bài tập 3:
The flow chart shows how waste paper is recycled. It is clear that there are six distinct stages in this process, from the initial collection of waste paper to the eventual production of usable paper.
Bài tập 4:
The map shows the growth of a village called Chorleywood between 1868 and 1994.
Bài tập 5:
The pie charts compare the proportion of carbohydrates, protein, and fat in three different diets, namely an average diet, a healthy diet, and a healthy diet for sport.
Hi vọng thông qua Unit 1, các bạn đã nắm được những kiến thức cơ bản về những dạng biểu đồ trong Task 1 và cách viết phần mở bài một cách hiệu quả.
Chúc các bạn học vui!

Đừng quên follow fanpage WISE ENGLISH và Group cộng đồng nâng band WISE ENGLISH để học thêm nhiều bí kíp giúp bạn NÂNG BAND THẦN TỐC và chinh phục các nấc thang của IELTS bằng Phương Pháp Học Vượt Trội và Lộ Trình Cá Nhân Hóa nhé.
Tìm hiểu thêm:
Khóa học IELTS cho người mới bắt đầu từ 0 – 7.0+ trong vòng 150 buổi
Trung Tâm Luyện Thi Ielts Đà Nẵng Tốt Nhất Không Thể Bỏ Qua